

Those following me on Xojo’s forum probably know that I am a big fan of the MBS plugins from Monkeybread Software. One of my favorites is the MBS ChartDirector plugin, which is wrapping ChartDirector from ASE (Advance Software Engineering) into Xojo.
With ChartDirector you can easily create with a few lines of code beautiful looking Charts.
But I struggled lately with the output quality for Retina (HiDPI) screens on the Xojo Web2 platform:
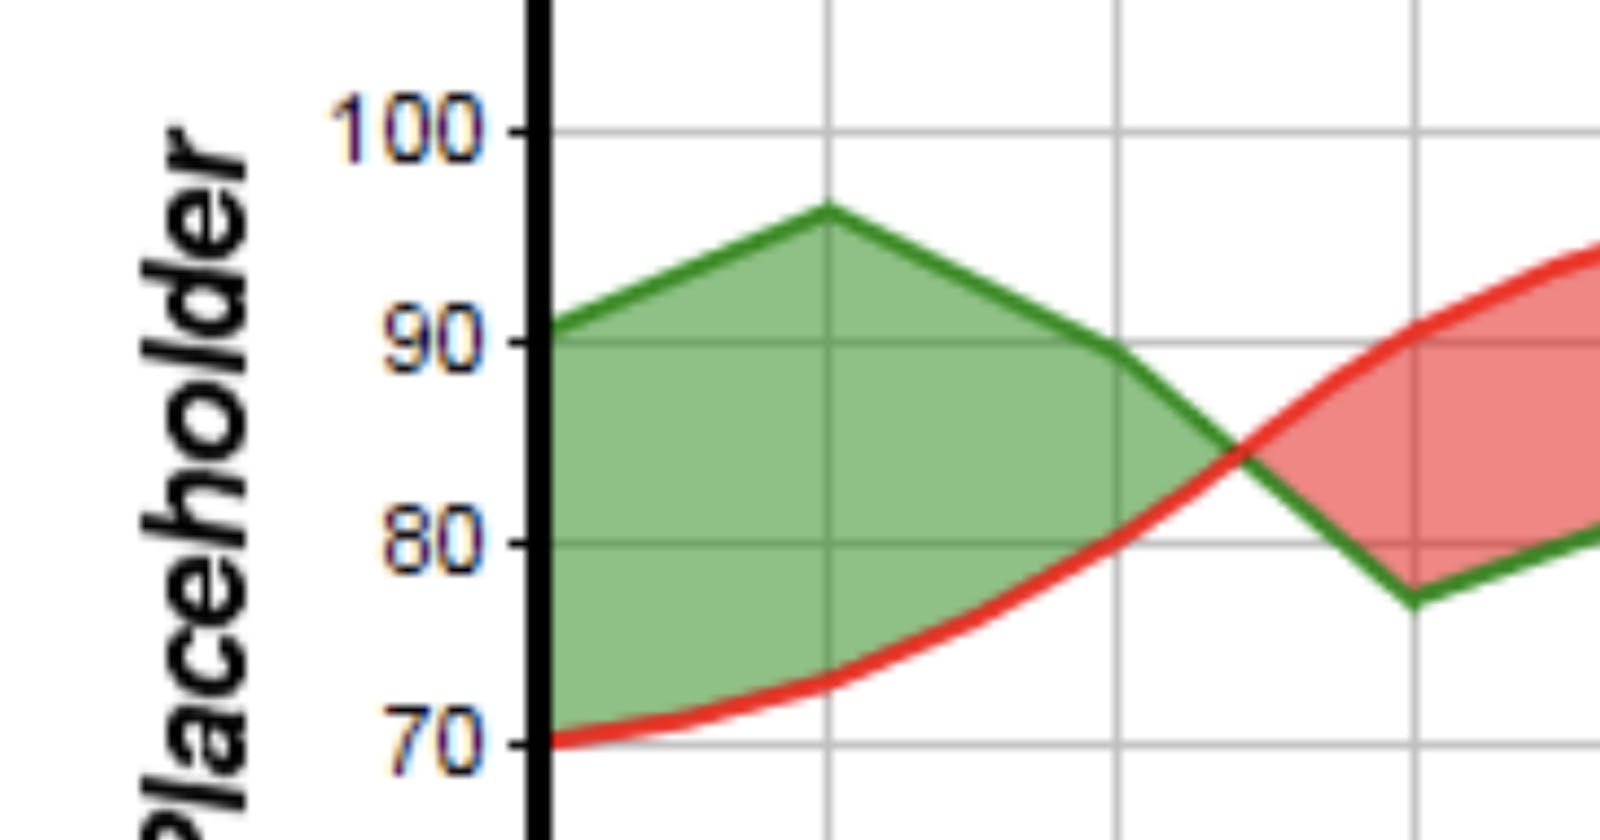
If you zoom in, it does of course not improve (no surprise here)
So I looked for a way to get this improved. You have to know that MBS Chartdirector is creating (incredibly fast) a picture in memory and you have to show that picture in a Xojo WebImageViewer for Web. Now you can use a scale factor as a parameter to create from one chart easily many versions of different resolutions, without even touching your main code. That’s very convenient indeed.
But until now, I have not found a way to tell Xojo Web2 to dynamically choose the right version of a picture depending on the resolution of the user. It doesn’t seem that you can associate multiple versions of your chart picture to one webPicture dynamically.
This frustrated me so much, that despite having a full license for MBS Chartdirector I tried out the new Xojo Chart functionality. Though it is doing a fantastic job drawing very crisp HiDPI charts (even with animations) it is still missing many features ChartDirector is coming with out-of-the-box.
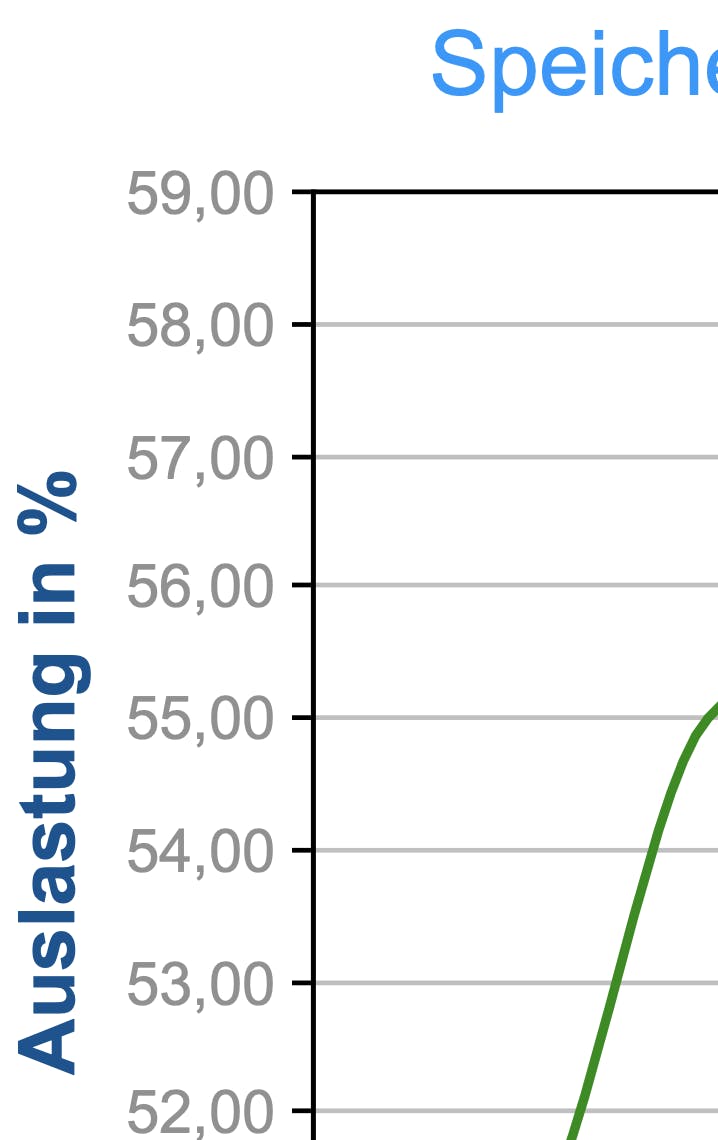
For instance, I could not achieve to change the axes labelling to show the decimal and the thousand separators in the user’s default settings. UTF8 ‘de-DE ‘ locale means for instance that the period is shown as a comma, and vice-versa. So what is shown in the US as 1,2345.67 has to be displayed as 1.2345,67 in good old Germany?
My dilemma: either using the full feature set of MBS Chartdirector and accepting an outdated look and feel, or opting for an excellent display of my charts but explaining to my customers, that I can’t display their values on charts in the “German” way. Obviously both “options” are not ideal.
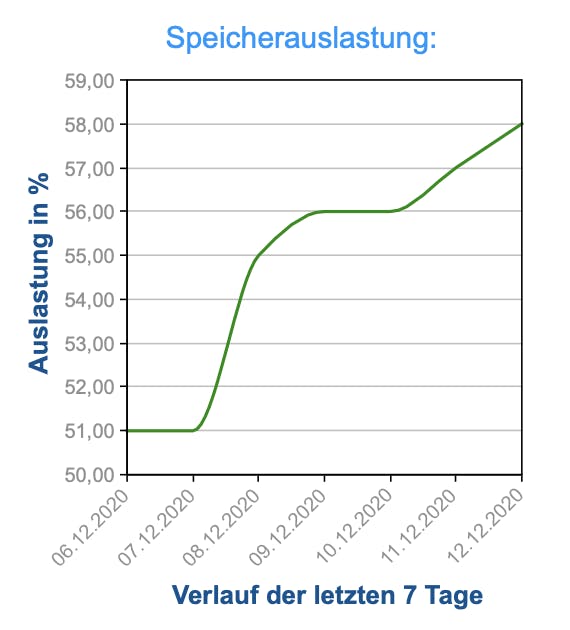
Yesterday night I played a bit around with one of the hundred examples which come with MBS Chartdirector:
It consists of a “WebImageViewer” drawing a chart in its “opening event” and then returning the drawn picture to itself.
The result is a nice chart in your browser.
But you can see that it is pixelated, even w/o zooming in, which of course only makes it look worse, that’s not acceptable in 2020:
While looking through the tons of options the MBS plugin is offering, I bumped into SVG and I played a bit around with it.
Now it turns out, that with 2 lines of code, you can convert every MBS chart in Xojo Web 2 to SVG data and you can populate your WebImageViewer control with these SVG data.
Let’s have a look at the results:

Fantastic, very crisp chart! Now let’s zoom in:
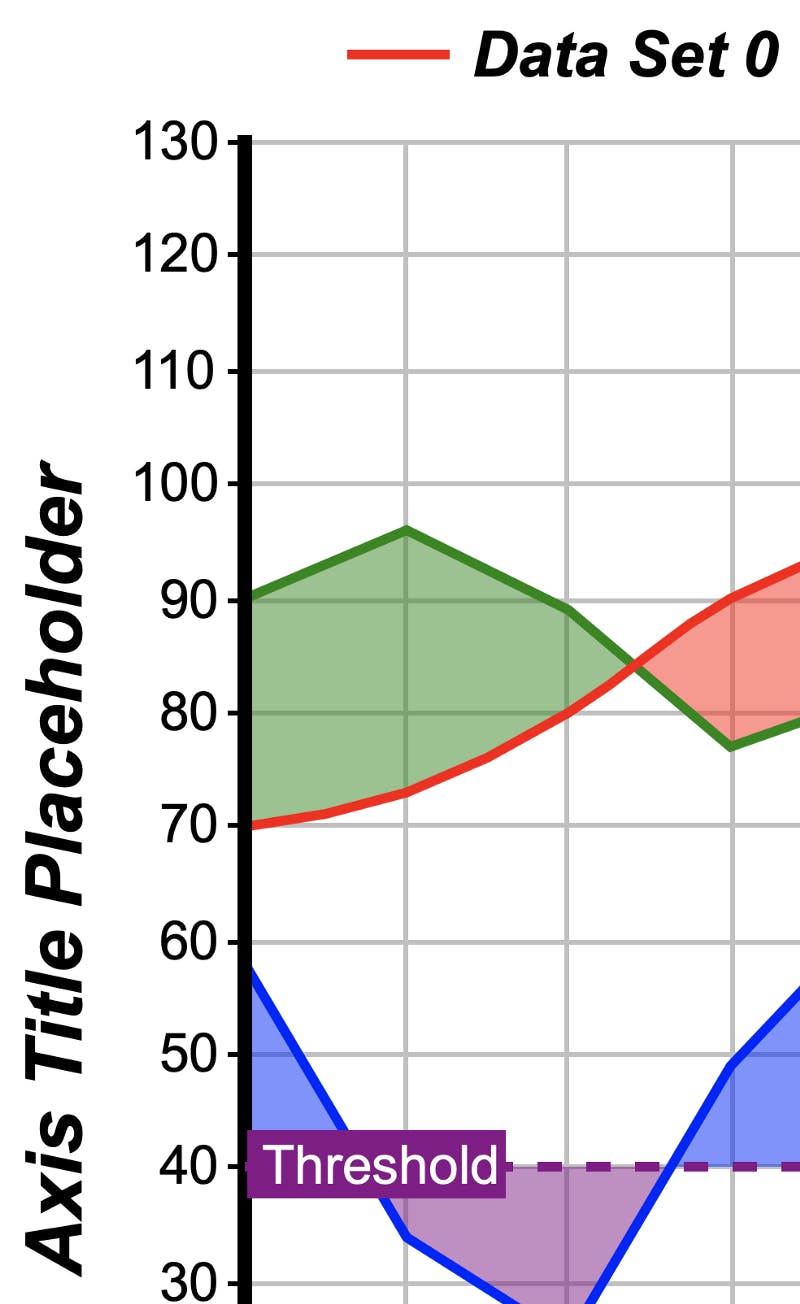
Crisp picture, scaling perfectly well.
Talking about scaling. This is yet another advantage of this method. You only need to resize your WebImageViewer control to the desired size, and your charts will scale automatically:
This is how it looks in the IDE:
And this is how it will look in the compiled app in your browser:
Zooming in the browser into the top left chart will still show a perfectly superb result:
My initial example above is now as well showing up perfectly sharp, and this by solely changing one line of code!
And zooming is still keeps it crisp and good-looking: